Second Quarter 2022 Collateral Pricing Update
By David Messina, Managing Director, Credit and Collateral Analytics and Modeling

To say that the first half of 2022 could be characterized as having above average volatility would almost be an understatement. Since the beginning of the year, benchmark overnight interest rates have increased 150 bps by way of three rate hikes each coming at increasingly higher increments (March: 25 bps, May: 50bps and June: 75 bps). That information alone could lead one to surmise that the Federal Reserve was possibly behind the curve in meeting market expectations. Factor in that inflation was most recently increasing at its fastest clip since December 1981, and it becomes quite apparent that we would have been in for a very bumpy ride.
And bumpy it has been. In addition to the 150 bps increase in short-term rates, medium-term tenors such as the 1-, 2- and 3-year U.S. Treasury yields have all increased by 200 bps or more since the Federal Reserve initiated its latest tightening cycle. To no one’s surprise, equity markets nosedived in the first half of 2022, registering the worst 6-month start to any year going back to 1970. Stock investors weren’t alone in their misery, as high yield corporates and subordinated RMBS and CMBS certificates were well into double-digit loss territory as well. To understand the nature of this market volatility and its implications for collateral prices and margins, we need to first examine the recent history of the Federal Reserve’s monetary tightening and its effect on price for financial assets.
Effects of Recent FOMC Policy Actions on Interest Rates and Spreads
The short-term overnight rate that the Federal Reserve uses as a target for managing borrowing costs across financial institutions in effect creates a minimum risk-free rate of return or yield for the shortest dated maturity investments (Fed Funds, secured repurchase agreements and overnight Bank Reserves). As maturities tend to increase, investors generally require higher yields as compensation for longer holding periods. This general preference for increasing yields as maturity lengthens creates an upward, or positive slope to the yield curve. The positive sloping feature of the Treasury yield curve, also known as a normal yield curve, tends to dominate in most historical financial periods. Indeed, even as the Federal Reserve has increased interest rates in 2022, the Treasury curve has remained positively sloped (through 6/30/2022). This tends to be indicative of a healthy or normal growth economic environment. Figure 1 below shows the Treasury curve (a benchmark for domestic risk-free rates for the last three-quarter end periods (Q4 2021, Q1 2022 and Q2 2022).
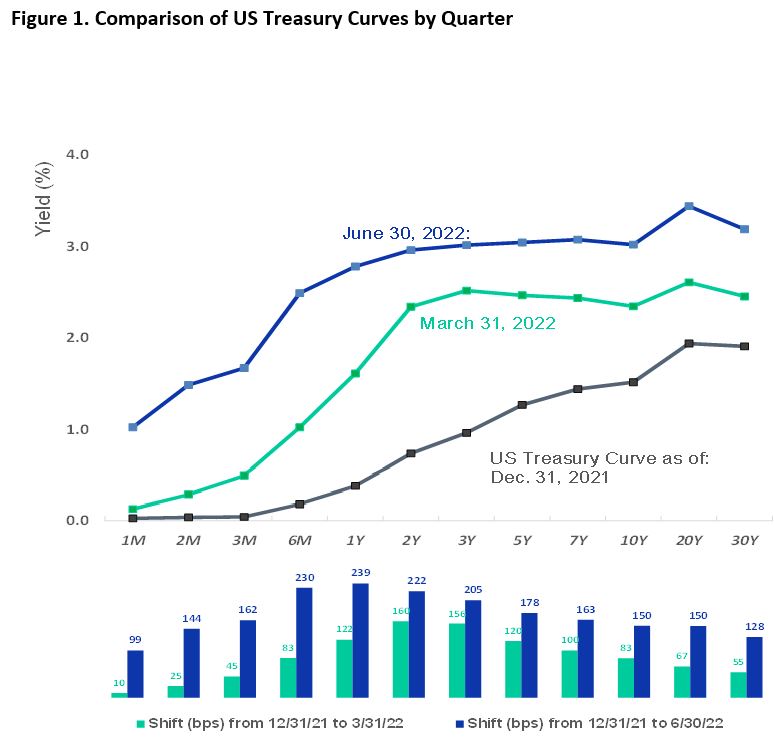
As the Federal Reserve continues to apply upward pressure on the short-end rate, most other medium- and longer-term rates will tend to move in similar fashion or a parallel shifting manner, at least initially. Over time, this becomes less consistent across rate tenors, with some increasing more than others and some not moving up at all. When this occurs, the curve is considered to be flattening or even inverted (long-term rates dropping below short-term rates). For the most part, the early phase of Federal Reserve rate tightening likely will keep the slope of the curve positive, which, as we will see, tends to reduce the market value of fixed income investments, all else being the same.
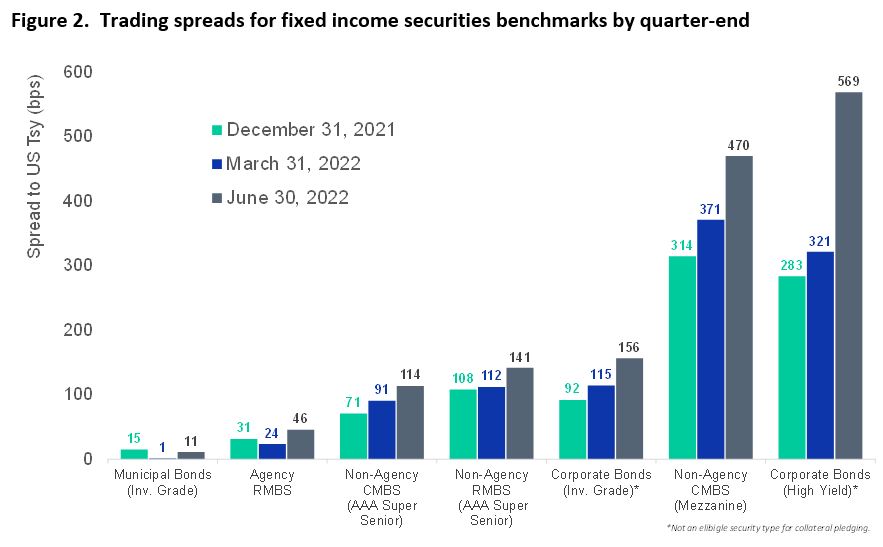
In addition to interest rate risk, mortgage loans and mortgage-backed securities have additional risk associated with holding this particular asset type. The main risks associated with MBS and mortgage whole loans are prepayment, liquidity, and in the case of certificates that do not come with a government guarantee, credit. Credit risk, or default risk, is the risk that a borrower may default on their loan, which creates a shortfall in cash flows to the investor. As a result of these risk factors, investors typically will require an additional return or spread over the yield of a similar term bond that does not have prepayment, liquidity, or credit risk (such as a U.S. Treasury note or other Government agency bond). Recently, the Bank’s Credit and Collateral Risk Management team has observed that as economic uncertainty has increased under the Fed’s increasingly hawkish approach to monetary policy, as observed in the first half of 2022, the spread or yield premium for credit- and prepayment-sensitive assets has also increased, as shown below in figure 2.
Impact on Member Pledged Collateral
The combination of higher interest rates, wider credit spreads and generally higher market volatility will have two primary implications for member pledged collateral. First, as interest rates and credit spreads increase, the value of fixed rate interest bearing, non-government guaranteed financial instruments such as corporate bonds, fixed-rate mortgage loans and non-agency mortgage-backed securities (MBS), tends to decline, all else being the same. The change in valuations can be readily observed using price indexes for commonly quoted fixed income products and benchmarks. Similarly, the Bank’s collateral portfolio which is primarily comprised of residential and commercial loans and securities, has also experienced depreciation in market value. Plotting these two components — the weighted average price of the collateral portfolio by asset type and an appropriate benchmark index — over time can be useful to illustrate how the pledged collateral portfolio has reacted to recent market events (e.g., FOMC rate changes). Figure 3 below shows the weighted average price of the Bank’s first lien residential whole loan and securitized MBS collateral portfolios plotted against the JP Morgan PLRMBS 2.0 AAA mortgage loan index. For reference the yield on a 5-year Treasury note is shown as an inverted series to demonstrate the close relationship between prevailing government risk-free yields and prices for similar maturity fixed-rate mortgage investments.
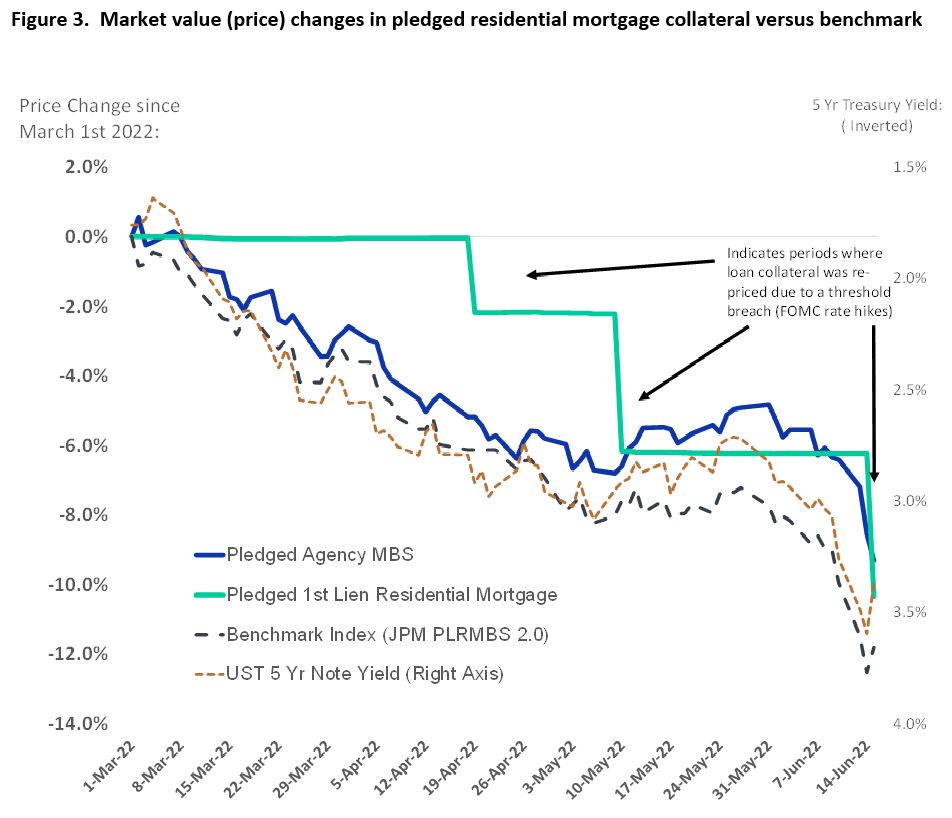
As shown in figure 3, the Bank’s pledged securities and residential loan portfolios show price declines in Q2, similar to that of the benchmark index. Pledged MBS collateral (dark blue line) tends to be majorly comprised of government agency-backed securities, such as Fannie Mae or Freddie Mac issued MBS pools and CMOs. Given that there is no credit risk associated with this portfolio, the price decline is expected to track slightly more favorably than that of the benchmark non-agency loan index (dotted grey line). The green solid line in the graph represents the Bank’s pledged first lien residential whole loan (unsecuritized) trend. This group is the largest pledged cohort in the Bank’s collateral portfolio. Notice the green line tends to form a downward step formation as opposed to a jagged downward trend pattern.
This occurs because, unlike daily valued securities collateral, the Bank, for operational reasons, revalues its pledged whole loan collateral only on a quarterly basis. In most periods, where price volatility for fixed income investments is relatively benign (benign being defined as equal to or less than a 3% downward change in price over a single calendar quarter), the Bank’s margin or haircut is sufficient enough to absorb the price decline risk, at least until the next scheduled quarterly re-pricing date occurs.
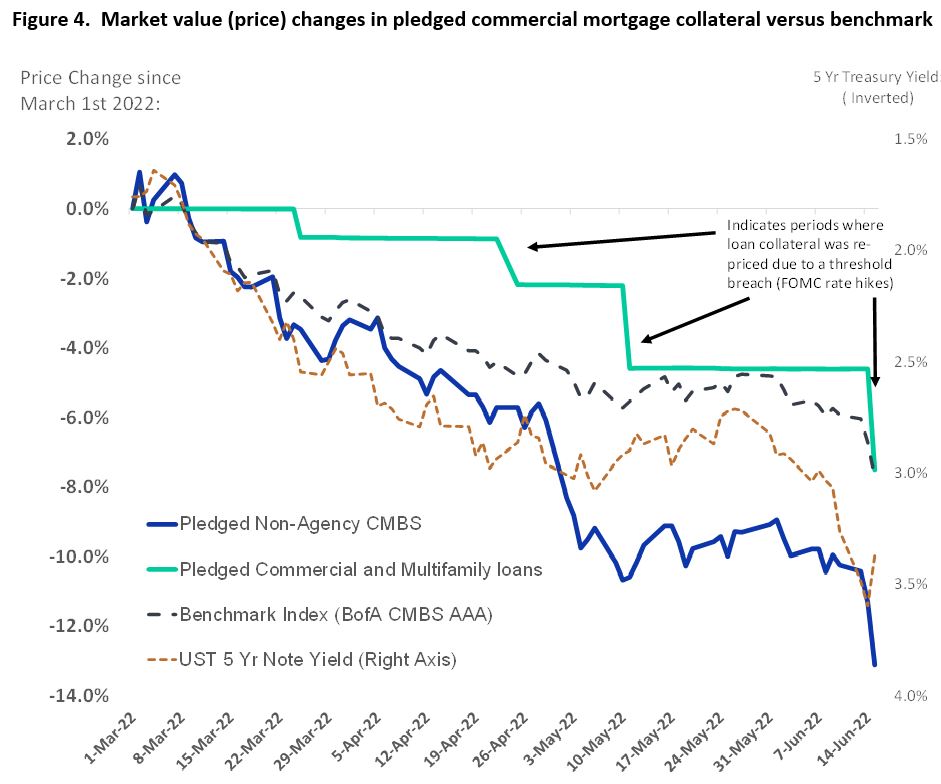
However, in periods where price volatility is high, such as in the second quarter of 2022 when the Federal Reserve was aggressively increasing interest rates, the Bank’s margin reserved for re-pricing risk may be slightly less than sufficient (i.e., the expected price decline in a quarterly period is greater than 3%). In these instances, the Bank, per policy, is required to revalue its loan collateral in advance of its normal quarterly schedule to reflect the price decline. The same is true for pledged commercial loans. As shown in figure 4, the commercial loan portfolio also exhibits a stepwise price decline trend, in contrast to pledged CMBS which as a result of daily re-pricing, generally has a more gradually declining price trend.
The second major implication for collateral given the recent uptick in volatilities for short- and medium-term interest rates concerns the margins or haircuts used against the price of pledged collateral. Since the start of the Fed’s pivot toward monetary tightening that began in the first quarter, the Credit and Collateral Risk Management division has generally preferred to manage the effects of changing market conditions through price adjustments, as opposed to margin changes.
Alternatively, the Bank could increase the haircut on the price of pledged collateral as means to offset or insulate the effects of higher price volatility. Recall from the previous section on market price changes that the Bank reserves 3% points of pledged loan market value as the margin to absorb price volatility within a calendar quarter (securities margin does not require a repricing margin component because of daily mark-to-market). If the Bank forecasted that collateral price declines were perpetually going to exceed 3% in future quarterly periods, the margin, in theory, could increase from 3% to a higher percentage, such as 5%, to offset this new higher volatility regime, thereby reducing the frequency of having to reprice loan collateral. At this time, the Bank is not recommending an adjustment to its collateral margins, preferring instead to use the more granular approach of intra-quarter market value adjustments made at or near the time when a re-pricing triggering event has occurred (such as a recent FOMC meeting).
As the market assimilates news regarding future expected rates of inflation versus the countermeasures of the Federal Reserve (rate hikes, balance sheet reduction), longer term interest rates have actually begun to decline as opposed to rising. In theory, the market is signaling that the FOMC’s recent policy decisions may be unwound sooner rather than later, thus negating the need for a higher policy margin to capture downward price pressure. That being said, the Bank remains generally agnostic to these forces, which ultimately continue to exert price pressure both upward and downward against the market value of fixed-rate financial instruments.
The Bank continues to manage these risks through its monitoring system as well as stress testing for all member pledged collateral, including both securities and loans. Should above normal price volatility persist, or interest rates stay elevated in a manner that increases the risk sensitivity profile of pledged mortgage assets, then the Bank may elect to increase its collateral policy margins at some point in the near future. Any future changes to the Bank’s collateral policy margins will be communicated to members six to eight weeks prior to taking effect, thereby ensuring adequate time is given for you to make any adjustments to your collateral composition should it be necessary to do so.
Throughout all market conditions, the Bank remains committed to supporting and strengthening its members’ liquidity needs by providing a reliable and low-cost source of funds. The prudent and timely management of collateral risk is an essential tool used by the Bank to achieve that objective. We thank you for your continued business, especially during this volatile and uncertain economic environment. If you have any questions regarding the value of your pledged collateral or the Bank’s collateral risk management practices, please do not hesitate to contact your Relationship Manager.