AOCI and its Capital Impact on Depository Members
By Wanjo Tarn, FRM, Associate Director, Member Credit
 During the pandemic, member banks and credit unions experienced a significant influx of deposits brought on by government emergency stimulus funding. To deploy these excess deposits in the absence of significant loan demand, many institutions allocated these funds into investment securities. From FYE 2019 to FYE 2021, our member banks’ total securities investments have grown by 82%, from an aggregate $561 billion to $1.02 trillion; member credit unions’ total securities investments have doubled, from an aggregate $40 billion to $82 billion during the same period.
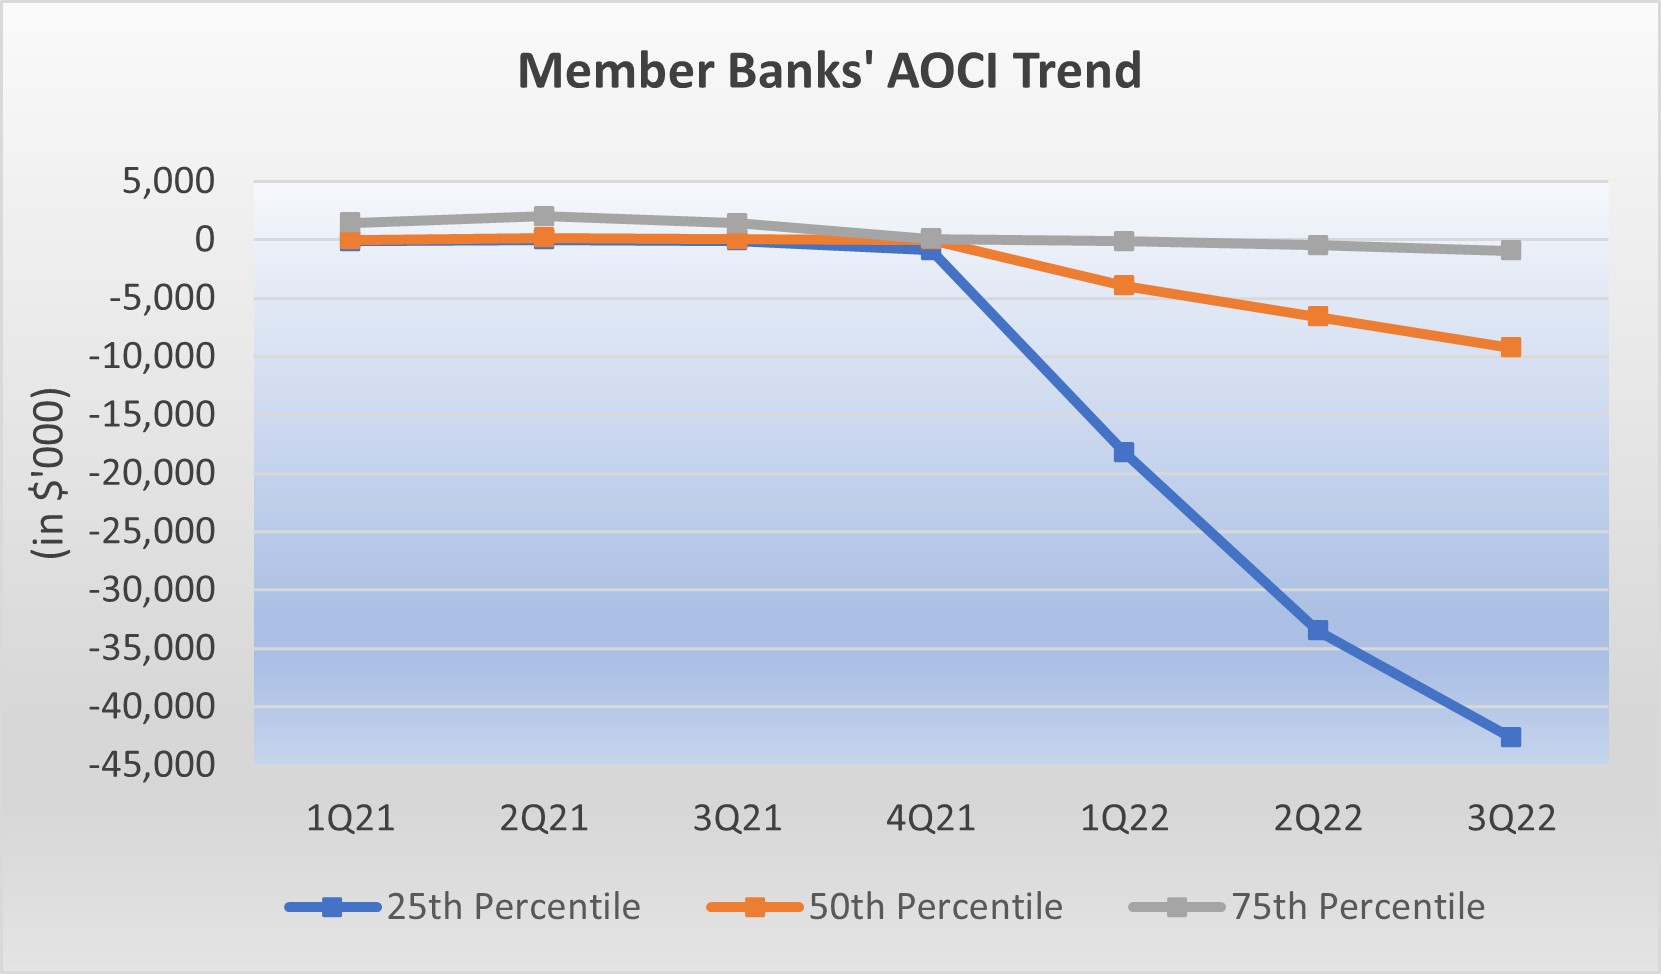
As interest rates have risen rapidly since the first quarter of 2022, banks have seen significant unrealized losses on their available-for-sale (AFS) securities portfolios. AFS securities are recorded at fair value on depository member’s balance sheets, with unrealized gains/losses recorded through the Accumulated Other Comprehensive Income (AOCI) account under equity. As shown in Figure 1 below, AOCI losses for our member banks increased sharply, from median losses of $3.9 million during the first quarter of 2022, down to $6.6 million in in second quarter 2022, and further declining to $9.3 million in the third quarter of 2022.
Figure 1 Member Banks' AOCI Trend:
Regulatory Capital Versus Tangible Capital
Regulatory capital rules allow banks that are not Advanced Approaches Institutions1 to add back these AOCI losses when calculating regulatory capital, the result of a one-time AOCI opt-out election that some institutions made in 2015. Based on data analysis, 98% of our member banks opted out of including the AOCI in regulatory capital, thus their Common Equity Tier 1 Capital (CET1) and other regulatory capital were not impacted by the AOCI losses. In fact, member banks’ CET1 otherwise increased over these quarters, attributable to solid retained earnings (Figure 2).
Figure 2 Trend of Member Banks' CET1 Capital and Tangible Capital:
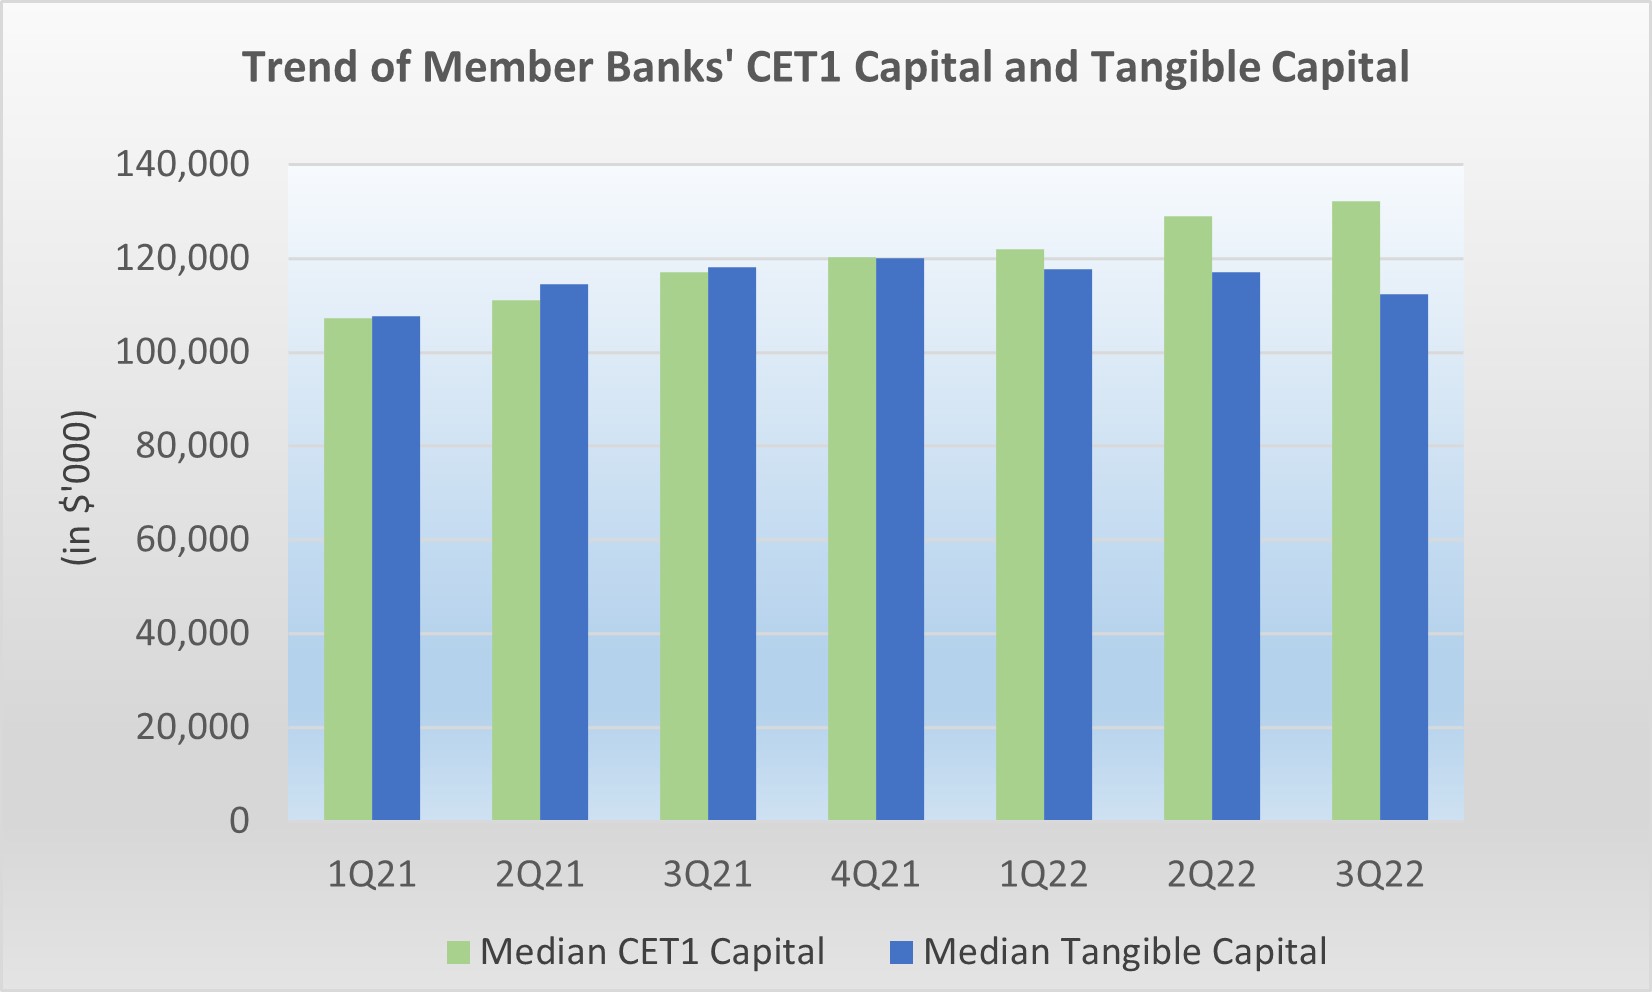
While regulatory capital was not affected by AOCI losses for institutions that opted out, the rising AOCI losses did have an impact on member banks’ Tangible Capital, as defined by 12.CFR § 1266.1 of Federal Housing Finance Agency (FHFA) regulations. After four quarters of increases in 2021, member banks’ Tangible Capital declined starting with the first quarter of 2022, down by a median of 2%, and continued with the declining trend in the second and third quarters of 2022. Figure 2 below demonstrates the different directions of CET1 and Tangible Capital trends of member banks.
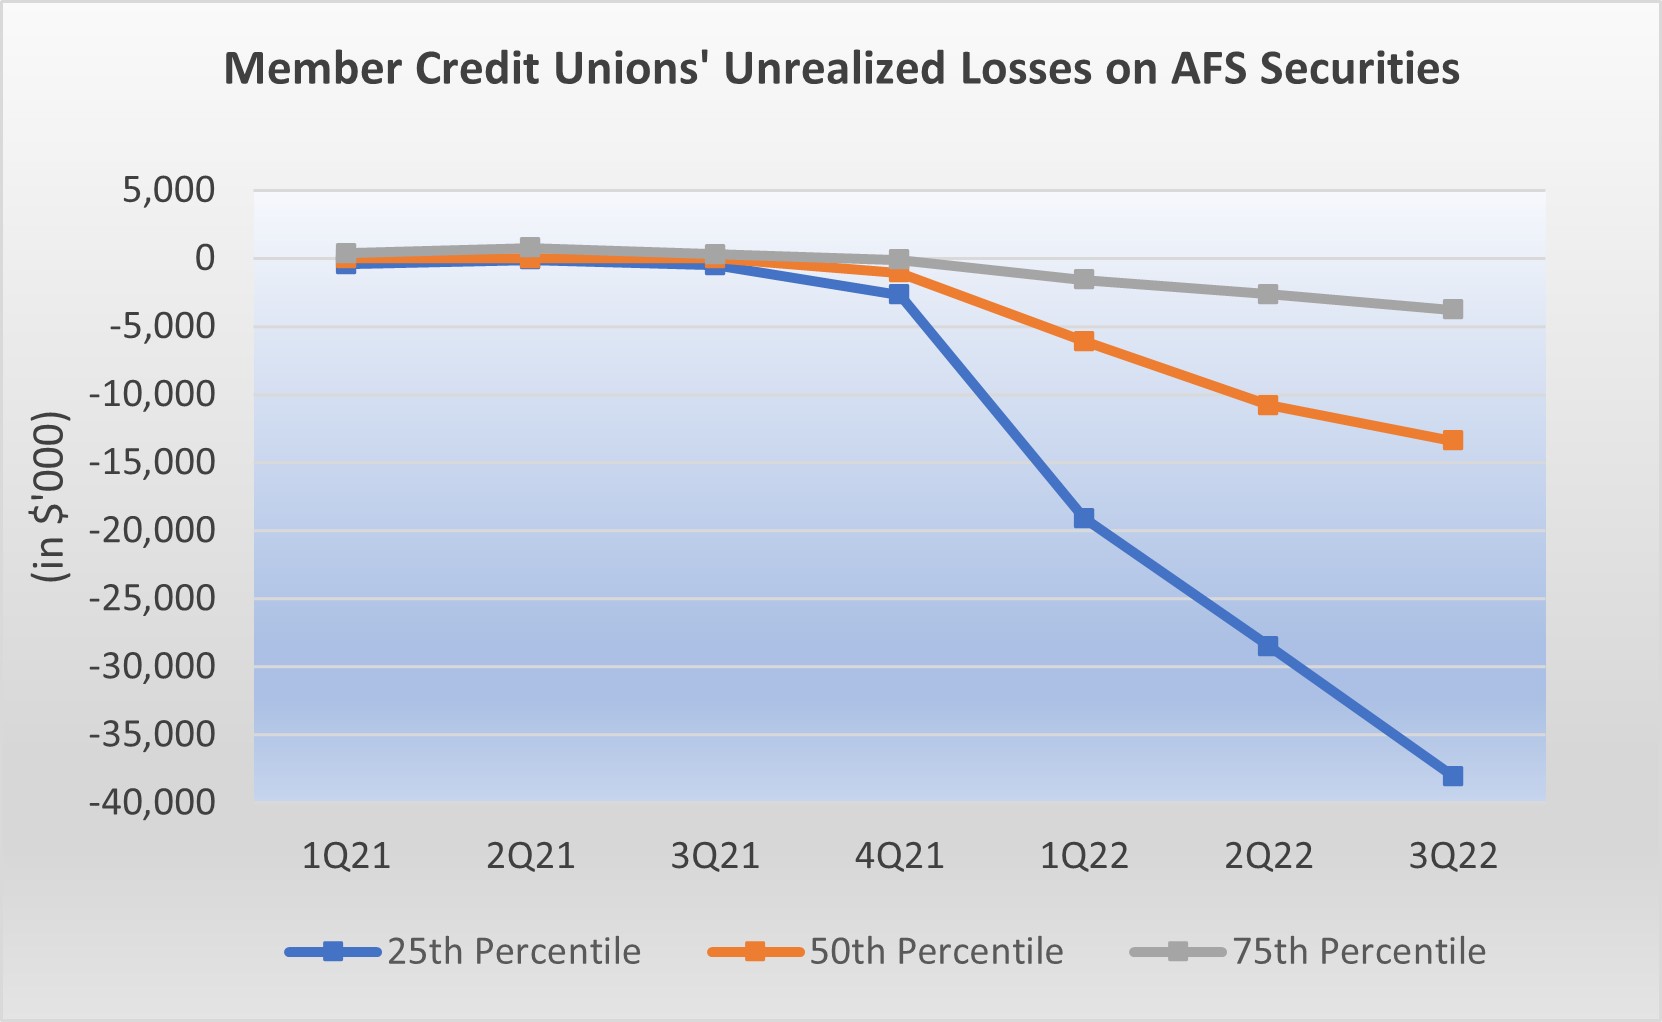
Similar to our member banks, member credit unions also recorded significant unrealized losses on AFS securities since the first quarter of 2022 as interest rates have risen. Based on data analysis, member credit unions’ unrealized losses trended higher, from median losses of $6.1 million in the first quarter of 2022, down to $10.8 million in the second quarter of 2022, and further declining to $13.4 million in third quarter of 2022, respectively (Figure 3).
Figure 3 Member Credit Unions' Unrealized Losses on AFS Securities:
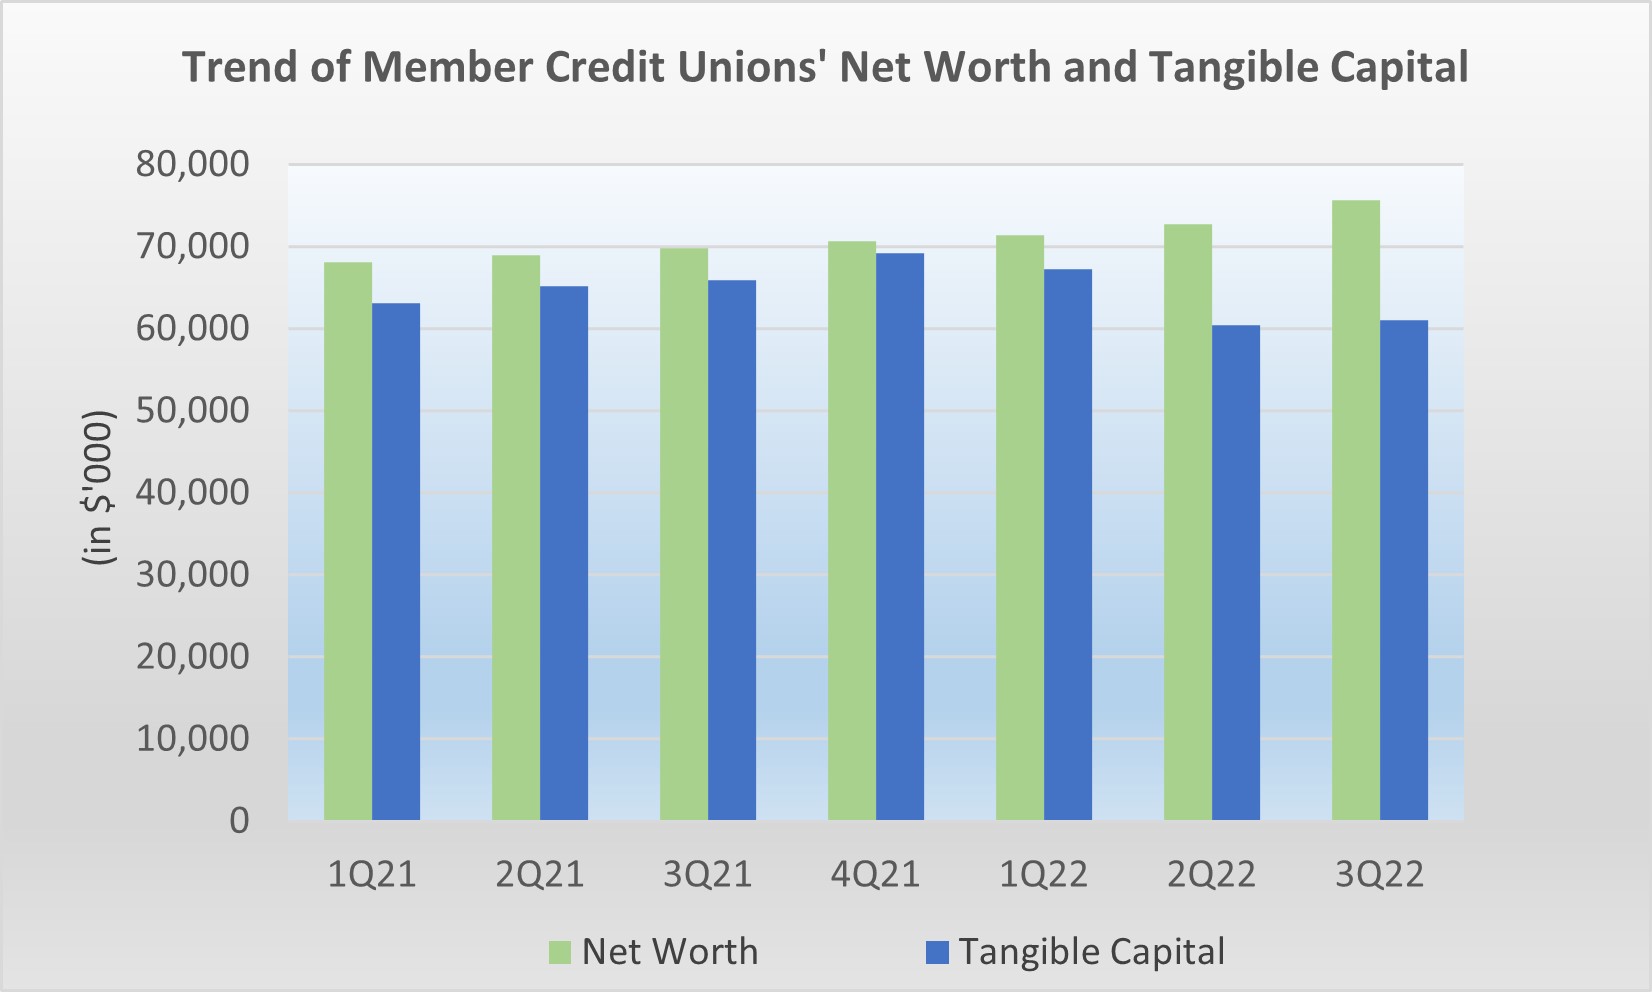
Credit unions’ regulatory net worth calculation does not factor in the unrealized losses (or gains) on AFS securities, thus regulatory net worth was not impacted by the increased unrealized AFS losses. Nonetheless, since unrealized losses (or gains) on AFS securities are recorded under equity, they affect credit unions’ balance sheet equity, which affects Tangible Capital. As reflected in Figure 4 below, the Tangible Capital of our member credit unions decreased by a median of 3% in the first quarter of 2022 and 10% in the second quarter 2022, respectively, on a quarter-over-quarter basis, albeit in the third quarter of 2022 the unrealized losses were offset by credit unions’ strong retained earnings which otherwise lifted Tangible Capital by a marginal 0.9% quarter-over-quarter.
Figure 4 Trend of Credit Unions' Net Worth and Tangible Capital:
Impact
Currently, FHFA’s Tangible Capital rule restricts the ability of the Bank to extend new advances to banks and credit unions with negative Tangible Capital and to renew existing advances beyond 30 days unless the Bank receives a written request from the appropriate federal banking agency or insurer that the Bank makes the advance.
As of the third quarter 2022, 99% of our depository members maintained positive Tangible Capital and thus were not affected by this regulation. In anticipation of further rate hikes, many depository institutions have also conducted additional capital raises or injections, and many have adjusted their investment portfolios by moving part of their AFS securities into Held-To-Maturity (HTM) portfolios, which are not marked to market, to protect Tangible Capital from further erosion from unrealized losses on AFS securities. We have observed that the percentage of HTM securities to total securities has increased from around 50% to over 60% for our member banks in the past two quarters, while the percentage of AFS securities has declined to below 40% of total securities. Regardless of the method, of the member banks and credit unions that we have talked to, they have been proactive in mitigating the AOCI effects on their Tangible Capital.
Looking Ahead
One of the ramifications of moving securities from AFS to HTM portfolios, however, would be the reduction of liquid assets held by depository institutions. In the third quarter of 2022, the median of liquid assets/ total assets ratios trended downward, from 25% to 23% for member banks and from 12% to 10% for member credit unions, respectively. As the Fed continues to tighten monetary policies to control inflation, liquidity is expected to be tighter amid outflows of deposits. In addition, lower market valuations of investment securities will continue to impact liquidity metrics.
As a liquidity provider, the Bank is committed to supporting our members through the unprecedented speed of recent interest rate hikes. In collaboration with the Bank’s relationship managers, our member credit team continues to maintain close contact with our depository members to discuss how the Bank can help them address any liquidity issues arising from the current financial environment. If you have liquidity concerns or needs, please do not hesitate to reach out to your Relationship Manager.
1 An advanced approaches institution is defined under federal regulatory capital rules if it has consolidated total assets of $250 billion or more, or consolidated total on-balance sheet foreign exposure of $10 billion or more, or is a subsidiary of a depository institution or holding company that is an advanced approaches institution, or has elected to use the advanced approaches to calculate its total risk-weighted assets.
Disclaimer: The information contained in this article is for informational purposes only and should not be construed as a solicitation or offer or advice (financial, legal, or otherwise) by the Bank. Cited information is derived from sources believed by the Bank to be reliable, but the Bank does not warrant the accuracy or reasonableness of the information or of any assumptions or other information contained in this article, and the Bank expressly disclaims responsibility for any errors or omissions in computing or disseminating the information, and any use to which the information is put. The Bank further expressly disclaims any obligation to update or correct the information presented in this article.